Tracing Liquidity Pathways Through Interstate Digital Card Rooms in Regulated US Markets
Lars Vogel · Aug 5, 2026
Tracing Liquidity Pathways Through Interstate Digital Card Rooms in Regulated US Markets
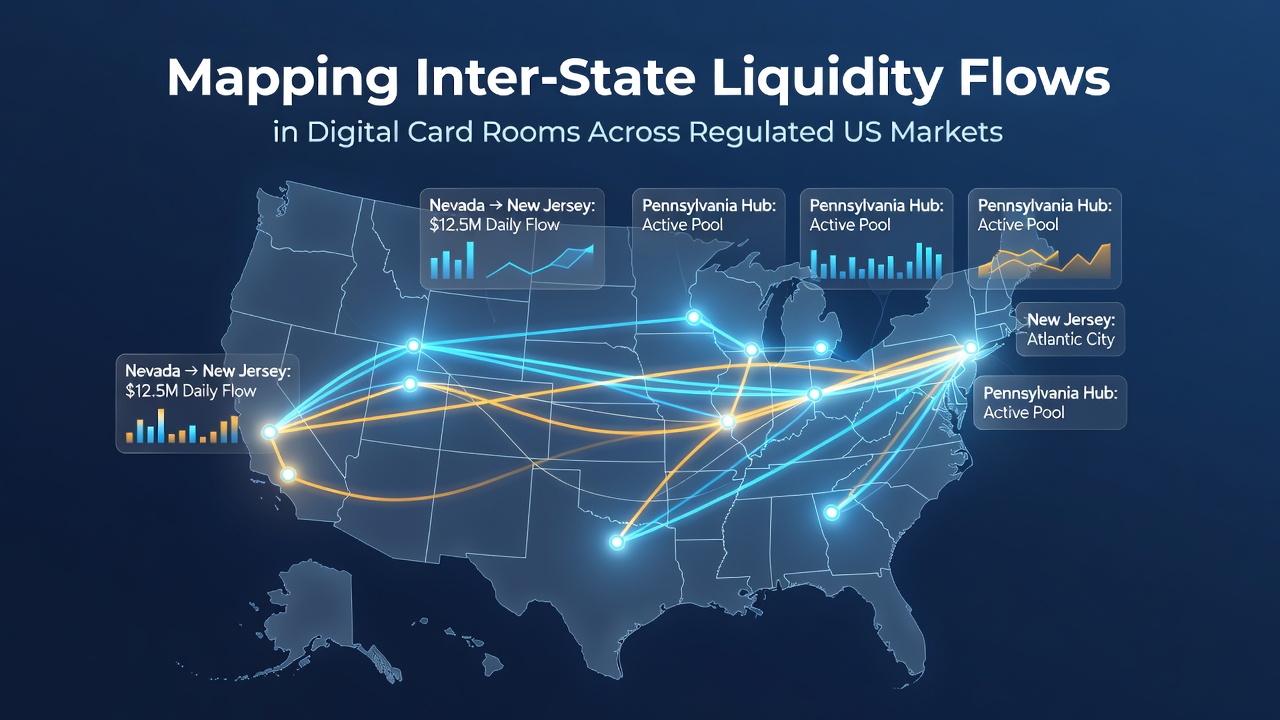
Regulated online card rooms operating across multiple US states now rely on shared player pools that move funds and participants between jurisdictions under formal interstate compacts, and mapping these movements requires tracking transaction volumes, player locations, and settlement processes that connect separate regulatory frameworks. Data collected by state gaming authorities shows that liquidity in these systems flows primarily through agreements between New Jersey, Pennsylvania, Michigan, and West Virginia, where operators consolidate tables while maintaining compliance with each state's rules on player verification and tax reporting.
Compact Structures and Pool Mechanics
Interstate agreements allow operators to combine player traffic from different states into single tables, yet each jurisdiction retains authority over its residents and requires separate accounting for gross gaming revenue generated within its borders. Researchers at the University of Nevada, Reno documented how these arrangements create daily settlement cycles in which funds move between state-specific ledgers based on player activity recorded at the moment of each hand. Observers note that the resulting liquidity map reveals concentrated flows during peak evening hours, with New Jersey and Pennsylvania exchanging the largest volumes because of their larger active player bases and earlier adoption of multi-state play.
Data Sources for Flow Analysis
State regulators publish monthly reports that break down poker revenue by player origin, and these figures form the foundation for liquidity mapping exercises conducted by industry analysts. According to reports from the New Jersey Division of Gaming Enforcement, interstate poker activity accounted for measurable portions of total handle in 2025, while similar disclosures from the Pennsylvania Gaming Control Board track cross-border contributions to combined pools. Analysts combine these public datasets with anonymized transaction logs supplied by licensed operators to construct heat maps that highlight corridors of highest activity between specific pairs of states.
Seasonal Patterns Observed in 2026
Figures released in August 2026 indicate elevated liquidity movement during summer months when recreational player counts rise across participating states. Regulators in Michigan and West Virginia recorded increased table occupancy rates linked to shared-pool access, and settlement data shows funds traveling more frequently between northern and mid-Atlantic jurisdictions during these periods. Those who study the datasets point out that weekends produce sharper spikes compared with midweek activity, creating predictable patterns that operators use to adjust staffing and server capacity.
Technical Infrastructure Supporting Visibility
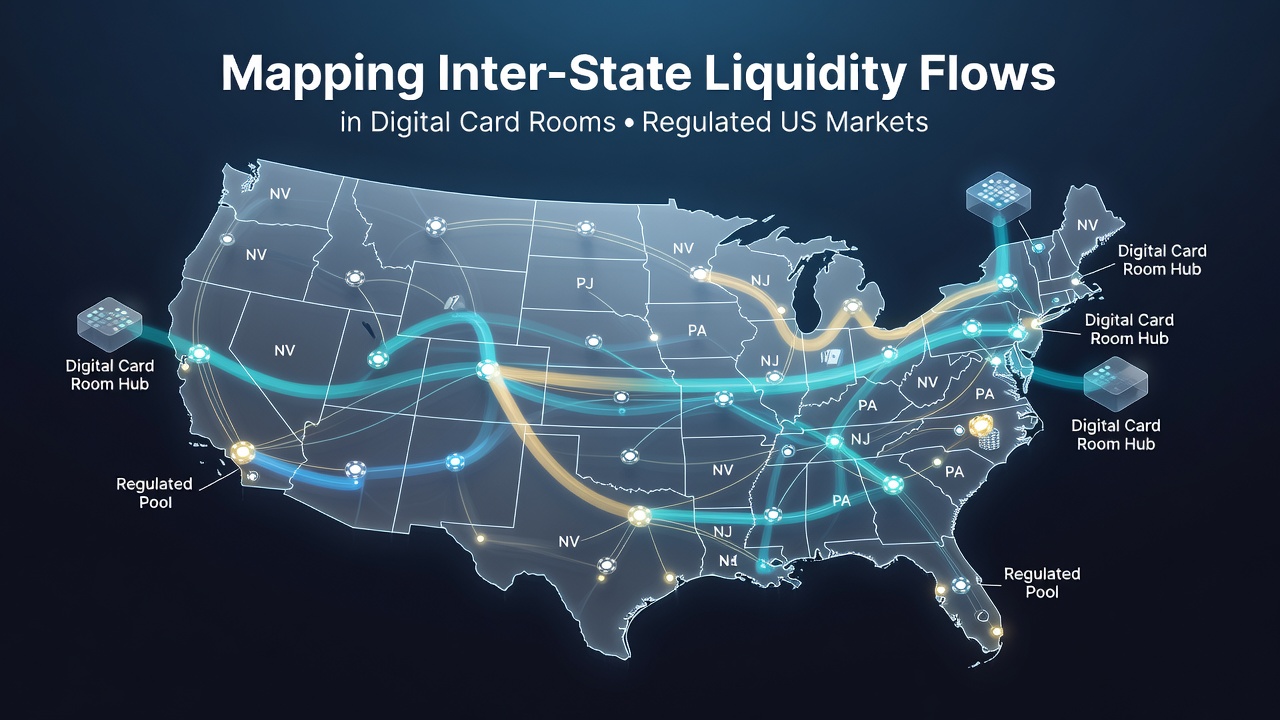
Operators deploy centralized risk and compliance engines that tag every wager with the player's verified state of residence, allowing downstream reconciliation systems to allocate revenue correctly while preserving the single-pool experience for participants. These systems generate audit trails that regulators access through secure portals, and the resulting datasets support third-party mapping projects that visualize flow direction and volume without exposing individual account details. Experts have observed that encryption standards and geolocation verification layers add latency to transaction recording, yet the overall architecture still permits near-real-time aggregation of liquidity statistics across state lines.
Regulatory Oversight and Reporting Requirements
Each participating state mandates that operators submit detailed poker reports distinguishing intra-state from interstate play, and these filings feed into broader economic impact studies produced by regional gaming associations. The American Gaming Association compiles aggregated statistics from multiple jurisdictions, creating composite views of how liquidity distributes across the national network of regulated card rooms. Analysts cross-reference these summaries with academic papers on digital gambling infrastructure to identify emerging corridors where new compact members could alter existing flow patterns.
Conclusion
Mapping inter-state liquidity flows in regulated US digital card rooms depends on coordinated data from state regulators, operator systems, and academic researchers who combine public filings with technical logs to reveal movement patterns across compact jurisdictions. Continued expansion of multi-state agreements will generate additional datasets that refine these maps, and analysts expect settlement volumes to scale alongside player growth in newly added states. The infrastructure already in place demonstrates how regulatory segmentation and shared-pool operation can coexist while producing transparent records of cross-border financial activity.